Soil mapping
Many countries place great importance in mapping their soil resources, as this provides invaluable information about the types of soil present, their distribution, and formation.
Soil maps are used by a wide range of individuals, including farmers, town and country planners, conservationists, foresters, teachers and students to name but a few.
Generally, soil maps are used to simply identify soils and their properties, but are sometimes required for more specific purposes, such as determining the suitability of a soil for particular crops, or the land drainage capabilities of an area.Like all maps, soil maps can be created in different scales. Small scale maps (which show less-detail) provide an overview of a region, whilst Large scale maps (which show high-detail) can be prepared where necessary for a local area such as a wildlife reserve or a farm.
Mapping information can be produced in paper form, or increasingly in digital mapping form through the use of a Geographical Information System (GIS), which uses the computer to store and manipulate data about soils and other related themes.
Soil Maps
 Producing maps to help to explain, understand and record the world around us is a very old art indeed. Mapmakers, or cartographers, draw a representation of the world - or some aspect of the world using different symbols, line styles and shadings. Maps are produced at a range of different scales depending on the map's anticipated use.
Once drawn up, maps can be printed off on large printing presses, folded up and made widely available. There are many organisations responsible for producing mapping in England and Wales. Notably the Ordnance Survey (or OS), being the national mapping agency, who produce a whole series of maps at different scales for differing purposes - from touristic maps, to land use maps to general purpose mapping. Other organisations produce maps along more specialist lines. The National Soil Resources Institute at Cranfield University is made responsible by Government for mapping the soils of England and Wales, just as the British Geological Survey is responsible for mapping the geology.
Soil Classification and Mapping
 The natural landscape changes around us in many dimensions; vertically down through different characteristics of soil (horizons), and laterally from one place to another. Soils can also vary in time - throughout a year, or gradually over longer time periods. Changes in soil characteristics can occur in all these dimensions making soil classification very complex.
In order to create a soil map, this complexity must be simplified. To do this soil classifications are used which place groups of like-characteristics together. There are many differing classifications, both historical and in use today. Because soils vary so much from place to place, many countries have developed their own classifications. There are several important international soil classifications also.
Maps can be created which represent the soils of a country or a region based on a classification system. Maps may also be made which represent some property or characteristic of soil, for example a map of how sandy the soils are in an area. Special maps may also be made which combine the properties of soil, together with other environmental characteristics such as rainfall patterns, for example a map of likely flood risk in an area.
Maps can be made to be of general widespread use. A general soil map of soil types across a county is an example. Such a map can be put to many uses. Maps can also be made for very specific purposes. Here the map helps to represent a particular understanding rather than to tell a general story. An example could be a map designed to show how suitable the land of an area is for growing a certain agricultural crop.
Map Scale
 All cartographical maps have scales. The scale determines how much detail can be shown on the map. For example, with a map at a scale of 1:50 000, a distance of 1 km is represented by one of 2 cm on the map; with a map at a scale of 1:250 000 1 km become 0.4cm. In describing mapscales, the greater the number of the mapscale (e.g. 1:250 000 map), we say the 'smaller' the mapscale is. Equally, the smaller the number of the mapscale (e.g. 1:50 000 map), we say the 'larger' the mapscale is. This sounds confusing at first and people do often confuse the terms, but it relates to the ratio between the length of real-world objects and those same objects drawn on the map.
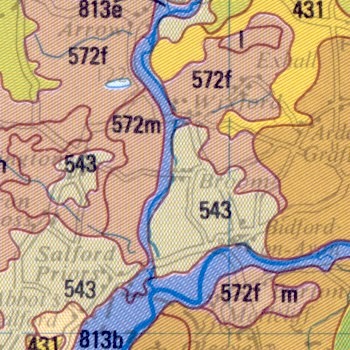
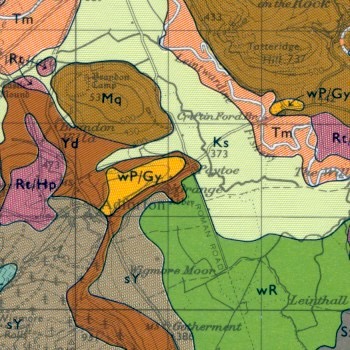
Small-scale soil maps (e.g. 1:250 000) then cannot show as much detail on the ground as large-scale maps (e.g. 1:50 000). Because of this, in small-scale maps, individual soil types may often be grouped together. British soil maps at 1:250 000 show boundaries for soil 'associations' - which just means groups of soil types that typically occur in the same area. A large-scale map could show boundaries for actual soil types as they can fit into the map more easily. The use of computer mapping tools such as a Geographical Information System allows maps of different scales to be displayed on the computer screen.
Soil mapping in context
There are several thousand different types of soil throughout the world, a fact that is not surprising when bearing in mind the differences there are worldwide in the agents responsible for the building and forming of soil (landscape, climate, geology, vegetation, time and man).We know that there are at least this number of soil types because they have been mapped. In the past 50 years many countries of the world have been involved in making maps of their soils to determine the range of soil types in their territory, where the soils occur and how they can be used. Soil mapping involves locating and identifying the different soils that occur, collecting information about their location, nature, properties and potential use, and recording this information on maps and in supporting documents to show the spatial distribution of every soil.
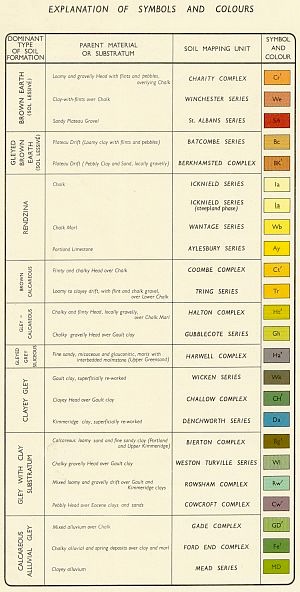
IIn order to map and identify different types of soil it is necessary to have a system of soil classification. Just as in the case of plants where we have the Linnaean system, so an equivalent approach is needed for soils. Soil classifications have provided a major challenge, one that has yet to be adequately solved. At present there is no single universally used system (unlike the case for plants). There are two international systems, FAO-UNESCO and US Soil Taxonomy, but a number of other systems have evolved and many countries have produced their own systems suited both to local conditions of soil formation and to local knowledge. However, the one uniform feature in all these systems is that they are based on the soil profile, that is the appearance of a section of the soil from the land surface through to the rock or other parent material that lies below the surface where the investigation is taking place. This examined thickness is usually about 1 metre but in tropical areas with deeper soil development it can be several metres, and in steep rocky landscapes may be much less than 1 metre. Soils are allocated to a type according to their profile characteristics including, abundance of organic matter in the topsoil, the texture (combination of the different particle sizes and their ratio), colours representing aerobic or anaerobic conditions, structure of each layer, etc.Traditional soil mapping is conducted with an auger and spade at intervals throughout the landscape. The intervals between inspections can be according to a pre-determined grid (grid-survey) or, more often, are based upon the judgement of the surveyor who uses their knowledge of the inter-relationship between soil type and landscape, geology, vegetation, etc to determine where to make inspections.
Auger borings are supplemented by excavated profile pits at determined points in the landscape. These profile pits are used to demonstrate lateral changes in the soil as well as vertical ones, and are important for the full description of type soils and for the taking of soil samples for chemical, physical and less commonly, biological laboratory analysis. In this way a picture is built up of the soil in a region and its relationship to the landscape in which it lies.
Soils can be mapped at a range of scales from very detailed at 1:1,250 to 1:5,000 by which the pattern of soils in individual fields can be identified, through to scales of 1:500,000 to 1:500,000,000 which provide only a very generalised picture of the soils of a country or continent.
Sometimes soils are mapped with a specific aim in mind, such as the suitability of soils for a particular crop, suitability for irrigation, erosion risk and many other specific needs or environmental threats. Most organised soil surveys in the past have been general purpose surveys. These have the advantage that they provide the basis for many different uses, some of which may yet not be known.